First-order Factors Of Polar Plots
First-order factors of polar plots

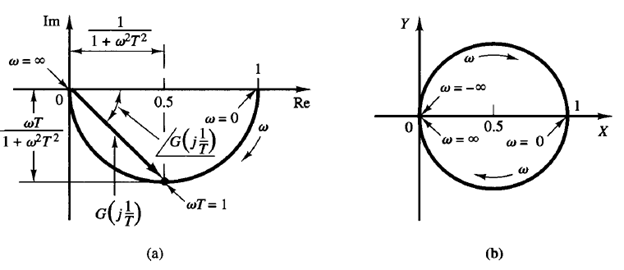
Fig: 1 Polar Plot
For the sinusoidal transfer function

the values of G(jω) at ω = 0 and ω = 1/T are, respectively,

If ω approaches infinity, the magnitude of G(jω) approaches zero and the phase angle approaches -900. The polar plot of this transfer function is a semicircle as the frequency ω is varied from zero to infinity, as shown in Figure 1(a). The center is located at 0.5 on the real axis, and the radius is equal to 0.5.
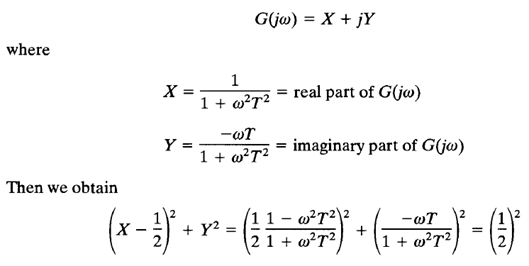
To prove that the polar plot is a semicircle, define


Thus, in the X-Y plane G(jω) is a circle with center at X = 1/2, Y = 0 and with radius 1/2, as shown in Figure 1(b).
The lower semicircle corresponds to 0 ≤ ω ≤ ∞, and the upper semicircle corresponds to -∞ ≤ ω ≤ 0.
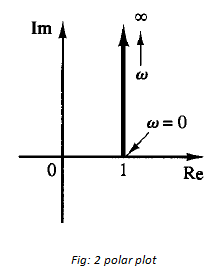
The polar plot of the transfer function 1 jωT is simply the upper half of the straight line passing through point (1,0) in the complex plane and parallel to the imaginary axis, as shown in Figure 2. The polar plot of 1 jωT has an appearance completely different from that of 1/(1 jωt).