Quadratic Factors Of Polar Plots
Quadratic factors of polar plots

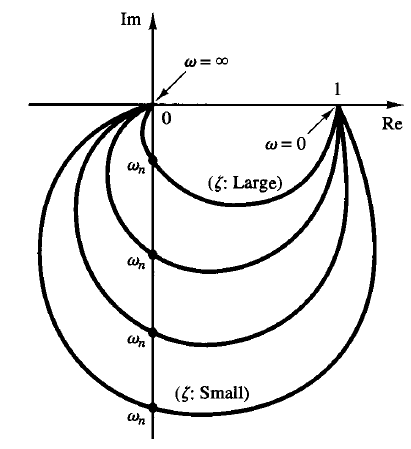
Fig: 1 Polar plots
The low- and high-frequency portions of the polar lot of the following sinusoidal transfer function

are given, respectively, by

The polar plot of this sinusoidal transfer function starts at  and ends at
  as w increases from zero to infinity. Thus, the high-frequency portion of G(jω) is tangent to the negative real axis. The values of G(jω) in the frequency range of interest can be calculated directly or by use of the Bode diagram.
Examples of polar plots of the transfer function just considered are shown in Figure 1. The exact shape of a polar plot depends on the value of the damping ratio  , but the general shape of the plot is the same for both the underdamped case (1 >
  > 0) and overdamped case (
 > 1).
> 1).