Unit-step Response Of First-order Systems
Unit-step response of first-order systems


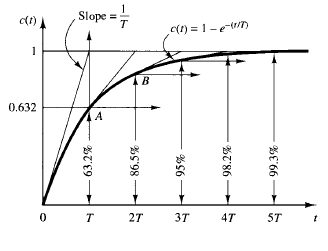
Fig: 2 Exponential response curve. Fig: 3 A general system
The exponential response curve c(t) is shown in Figure 2. In one time constant, the exponential response curve has gone from 0 to 63.2% of the final value. In two time constants, the response reaches 86.5% of the final value. At t = 3T, 4T, and 5T, the response reaches 95%, 98.2%, and 99.3%, respectively, of the final value. Thus, for t ≥ 4T, the response remains within 2% of the final value.
The steady state is reached mathematically only after an infinite time. In practice, however, a reasonable estimate of the response time is the length of time the response curve needs to reach the 2% line of the final value, or four time constants. Consider the system shown in Figure 3.

Fig: 4
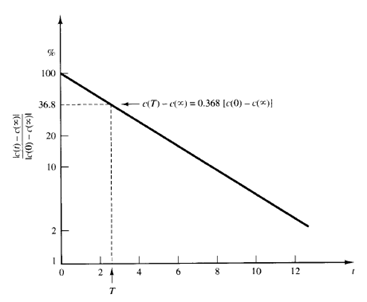
To determine experimentally whether or not the system is of first order, plot the curve log |c(t) - c(∞)|, where c(t) is the system output, as a function of t. If the curve turns out to be a straight line, the system is of first order. The time constant T can be read from the graph as the time T that satisfies the following equation:
