Advanced Statistical Quality Control

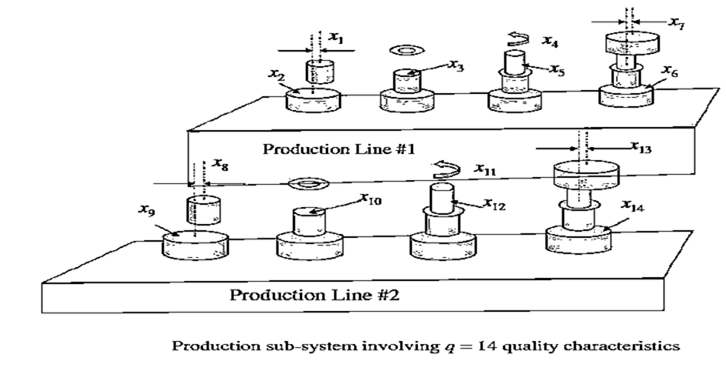
I. The phrases “Hotelling’s T2 charting” or, equivalently, “multivariate charting” refer to a method proposed in Hotelling (1947). This method permits asingle chart to permit simultaneous monitoring of a large number of continuousquality characteristics. This allows the user to regulate the false alarm rate directlyand to reduce the burden of maintaining a large number of charts.
II. For single characteristic charts, the usual situation is characterized by plotted points inside the interval established by the control limits. With multiple characteristics, averages of these characteristics are plotted in a higher dimensional space than an interval on a line.
III. The term “ellipsoid” refers to a multi-dimensional object which in two dimensions is an ellipse or a circle. Under usual circumstances, the averages of quality characteristics lie in a multidimensional ellipsoid.
Multivariate Charting (Hotelling’s T2 Charts):
I. This chart has been proven useful for applications that range from college admissions to processing plant control to financial performance.
II. The method has two potentially adjustable parameters. The symbols used are the following: q is the number of quality characteristics being monitored.
III. r is the number of subgroups in the start-up period. This number could be as low as 20, which might be considered acceptable by many.
IV. The default value suggested here is r = 50, but even higher numbers might be advisable because a large number of parameters need to be estimated accurately for desirable method performance.
V. α is the overall false alarm rate, is adjustable. Often, α = 0.001 is used so that false alarms occur typically once every thousand samples.
VI. xijk is the value of the ith observation, of the jth characteristic in the kth period.
VII. T2 the quantity being plotted which is interpretable as a weighted distance from the center of the relevant ellipsoid. Note that identifying the assignable cause associated with an out-of-control signal on a T2 chart is not always easy.
VIII. Sometimes, software permits the viewing of multiple Xbar & R charts or other charts to hasten the process of fault diagnosis. Also, it is likely that certain causes are associated with certain values taken by linear combinations of responses. This is the motivation for many methods based on so-called “principle components” which involve plotting and studying multiple linear combinations of responses to support rapid problem resolution. Also, note that multivariate charting has been applied to such diverse problems as college admissions and medical diagnosis.