Demerit Charting And U-charting
Introduction: demerit charts plot a weighted sum of the nonconformities per item. u-charting plots the number of nonconformities per item inspected; this method is described together with demerit charts.
Attribute Data: Demerit Charting and u- Charting:
1. The term “nonconformity” was defined as an instance in which a part or product’s characteristic value falls outside its associated specification limit.
2. Different types of nonconformities can have different levels of importance. For example, some possible automotive nonconformity can make life-threatening accidents more likely. Others may only cause a minor annoyance to car owners.
3. The term “demerits” here refers to a weighted sum of the nonconformities.
4. The weights quantify the relative importance of nonconformities in the eyes of the people constructing the demerit chart.
5. The following symbols are used in the description of demerit charting:
a. nis the number of samples in each rational subgroup. If the sample size varies because of choice or necessity, it is written ni, where i refer to the relevant sampling period. Then, n1 n2 might occur and or n1 n3 etc.
b. csare the number of particularly serious nonconformities in a subgroup.
c. ctis the number of typical nonconformities in a subgroup.
d. c is the weighted count of nonconformities in a subgroup or, equivalently, the sum of the demerits. In terms of the proposed convention:
e. c = (5.0 × cs 1.0 × c)
f. u is the average number of demerits per item in a subgroup. Therefore, u = c ÷ n
g. u0 is the true average number of weighted nonconformities per item in all subgroups under consideration.
6. The method known as “u-charting” is equivalent to demerit charting, with all nonconformities having the same weight of 1.0. Therefore, by describing demerit charting, in Algorithm, u-charting is also described.
7. Similar considerations related to sample size selection for p-charting also apply to demerit charting. If u0 is the average number of demerits per item, it is generally desirable that n × u0 > 5.
8. The following method is written in terms of a constant sample size n. If n varies, then substitute ni for n in all the formulas. Then, the control limits would vary from subgroup to subgroup. Also, quantities next to each other in the formulas are implicitly multiplied with the “×” omitted for brevity, and “/” is equivalent to “÷”. The numbers 3.0 and 0.0 in the formulas are assumed to have an infinite number of significant digits.
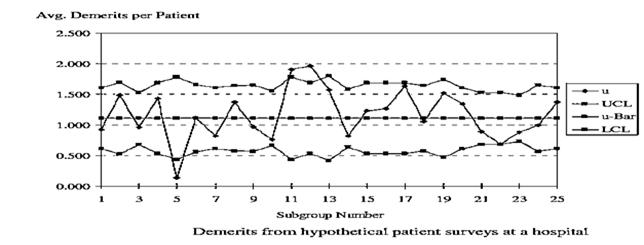
Example: summarizes the results from the satisfacturing survey written by patients being discharged from a hospital wing. It is known that day 5 was a major holiday and new medical interns arrived during day 10. Construct an SPC chart appropriate for monitoring patient satisfaction.
Answer:
Complaints can be regarded as nonconformities. Therefore, demerit charting fits the problem needs well since weighted counts of these are given.
C = 1.0 × (22 28 … 45) 5.0 × (3 3 … 2) = 1030 and N = 40 29 … 45 = 930.Therefore, in Step 1
u0= 1030 ÷ 930 = 1.108.The control limits vary because of the variable sample size.
. The u plotted for Day 1 is derived using (1.0 × 22 5.0 × 3) ÷ 40 = 0.925. The day 1 UCL is given by 1.108 3.0 × sqrt (1.108 ÷ 40) = 1.61. The day 1 LCL is given by 1.108 – 3.0 × sqrt (1.108 ÷ 40) = 0.61.
