History Of Statiscs And Quality
Introduction:
History is intended to establish a context for the current quality and six sigma movements. This explanation of the history of management and quality is influenced by Womack and Jones (1996) related to so-called “Lean Thinking” and “value stream mapping”.
History of Statistics and Quality:
Corporations routinely apply statistical methods, partly in response to accountability issues, as well as due to the large volume of items produced, miniaturization, and mass customization.
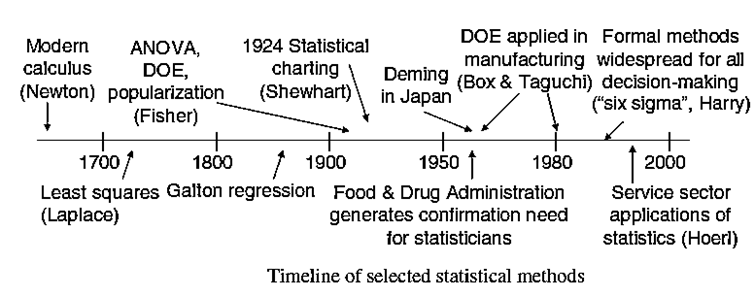
An overview of selected statistical methods is provided in Figure below.
The origin of these methods dates back at least to the invention of calculus in the 1700s.
Least squares regression estimation was one of the first optimization problems addressed in the calculus/optimization literature. In the early 1900s, statistical methods played a major role in improving agricultural production in the U.K. and the U.S. These developments also led to new methods, including fractional factorials and analysis of variance (ANOVA) developed by Sir Ronald Fisher (Fisher 1925).

The realities of mass production led W. Shewhart working in 1924 at Bell Laboratories to propose statistical process control (SPC) methods
The specific “X-Bar and R” charts he developed are also called “Shewhart” charts. These methods discourage process tinkering unless statistical evidence of unusual occurrences accrues. Shewhart also clarified the common and harmful role that variation plays in manufacturing, causing a small fraction of unit characteristics to wander outside their specification limits.
The implementation of Shewhart charts also exposed many unskilled workers to statistical methods.
ExampleJapanese Technology
Drawing on information from this chapter and other sources, briefly describe three quality technologies transferred from Japan to the rest of the world.
Answer: First, lean production was developed at Toyota which has its headquarters in Japan. Lean production includes two properties, among others: inventory at each machine center is limited using kanban cards, and U-shaped cells are used in which workers follow parts for many operations which instill worker accountability.
However, lean production might or might not relate to the best way to run a specific operation. Second, quality circles constitute a specific format for sharing quality-related information and ideas.