Limit Test
Sigma Tests:
1. They provide an “early” alarm indicator that must stimulate searching for possible assignable causes and, if the case, identify and eliminate them.
2. One and Two sigma tests point out a potential anomalous “trend” that “may” undertake assignable causes. In general, due to the high variance in software processes especially when we manage individual rather than sample data, the faults highlighted by these tests could be numerous but less meaningful than in manufacturing contexts.
3. For example, in a manufacturing process a party of poor quality raw material may be a potential assignable cause that must be investigated and removed.
4. In a software process, a possible assignable cause may be an excessive computer crash due to a malfunctioning peripheral but also to a headache of the developer.
5. Different considerations could be made if the point on the chart represents a group of observations, such as the productivity of a development team. In this case the peaks accountable to a single developer’s behavior are smoothened. Therefore, the point on the charts may express a general behavior determined by an assignable cause.
6. Similar considerations can be made on the use of Three sigma test, based on a single observation that falls outside limits, rather than One or Two sigma tests, that refer to a sequence of observations and thus to a “potential behavioral trend”.
Limit Tests:
1. This class of tests point out an occurred shift in process performances. They highlight the need to recalculate the control limits when the actual ones are inadequate, because they are too tiny or larger than required.
2. In software process monitoring and improvement we represent a measurable characteristic that expresses human related activity outcomes (time spent, productivity, defect found during inspection etc.) on a control chart. Thus while a single point falling outside control limits can be interpreted as the result of a random cause, a “sequence” of points means that something has changed within the process.
3. The Run above or below the Centerline Test watches for 8 points on one side of the central line. If this pattern is detected, then there is strong evidence that the software process performance has changed in better or worse. The longer the sequence is, the stronger the evidence is.
4. A failure of the Mixing/Overcontrol Test could mean more than one process being plotted on a single chart (mixing) or perhaps over control (hyper-adjustment) of the process. In software process this test failure highlights that the process is becoming less predictable than in the past. Typically this occurs immediately after an induced improvement, and continues until the improvement is fully acquired by the developers or organization.
Trend Tests:
1. While the previous tests class points out the presence of an occurred shift, this one highlights an ongoing or just occurred phenomenon that represents an ongoing shift that needs to be investigated. Typically, a failure in this test class can be the result of both spontaneous and induced process improvement initiatives. The tests will be briefly commented.
2. When the Oscillatory Trend Test is positive, two systematically alternating causes are producing different results. For example, we may monitor the productivity of two alternating developer teams, or monitor the quality for two different (alternating) shifts. As a consequence the measurable characteristic observed must be investigated in a more straightforward way in order to isolate the two causes. Probably, when this test fails we are observing the wrong characteristic or the right one measured in a wrong way.
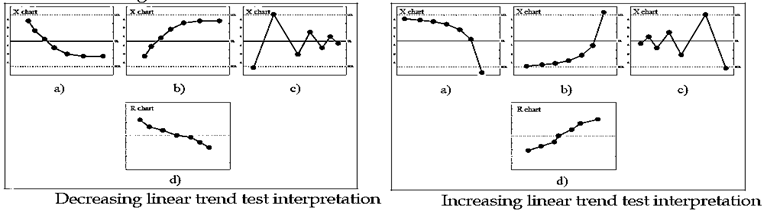
3. The Linear Trend Test fails when there is a systematic increasing or decreasing trend in the process. This behavior is common and frequent in software processes. It is the result of an induced process improvement, such as the introduction of a new technology, or a spontaneous one, such as the maturation effect. This test, give insightful remarks when it fails on R chart and it is interpreted jointly between X and R charts.