←
Six Sigma
Low Cost Response Surface Method
The Selection of the Factors:
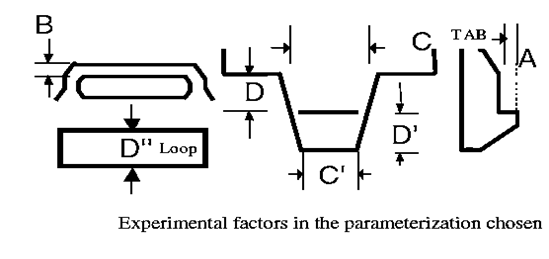
In this “parameterization” or framing of the problem, one could not “dial up” a wide loop and a narrow tab. Figure below shows the selected primary factors (A, B, C, and D) and the sub-factors that depended on them (C′, D′, and D′′).

- Note that any ambiguity in the choice of parameterization could actually increase interest by the practitioner in the methods described in this book.
- This follows because these technologies permit more factors to be studied, modeled, and optimized over with generally higher probabilities of achieving desired outcomes than alternatives such as one-factor-at-a-time (OFAT).
- With more factors, one has substantially greater freedom to investigate parameterizations that permit effects to be separated and better understood.
General Procedure for Low Cost Response Surface Methods:
The application of low cost response surface methods is similar to that of standard two-step response surface methods except multiple models are fit instead of one and the diagnostic test is different.
The Engineering Design of Snap Fits:
- In the engineering design the application of LCRSM to derive the empirical prediction models of the pull-apart and insertion forces for the snap tab project. Results are modified slightly to preserve confidentiality.
- In the real study, a similar method was applied and achieved similar results.
- The steps in the development of the model for the snap tab pull apart force and insertion forces were as follows.
- In Step 1,the team used the factors. The 12 sets of responses are also shown. The engineering ranges for the factors A, B, C, and D were 1.0 mm to 2.0 mm, 1.7mm to 2.1 mm, 10.0mm to 20.0mm, and 5.0 mm to 10.0 mm, respectively. The response Y1 was the pull-apart force in pounds (lb), and Y2 was the insertion force in lb. in the right-hand columns. Figure 17.5 illustrates finite element method (FEM) runs, showing the stresses placed on each element of the snap fit during a simulated pull apart at the point of breakage.
-
In Step 2,the four linear regression model forms were fitted to each of the responses and selected the one with the lowest sum or squares error. The selected models for each response were:
