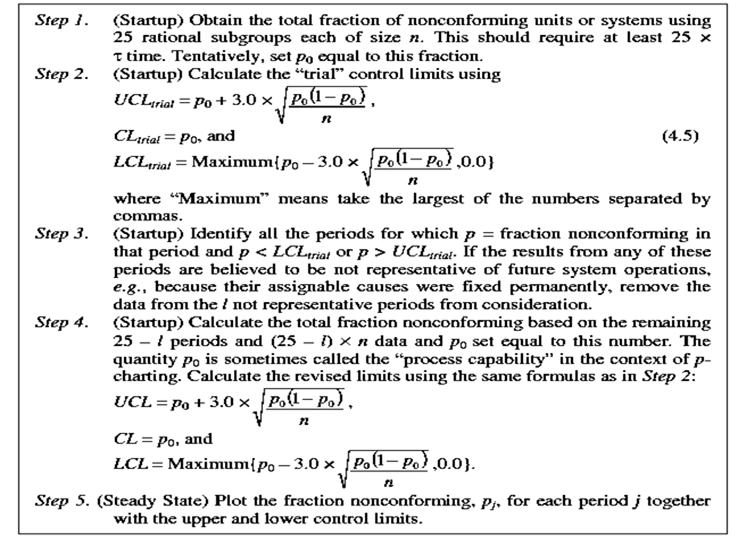
P-charting

- Note that the following method is written in terms of a constant sample size n.
- If n varies, then substitute ni for n in all formulas. Then the control limits would vary subgroup to subgroup. Also, quantities next to each other in the formulas are implicitly multiplied, with the “×” omitted for brevity.
- The numbers 3.0 and 0.0 in the formulas are assumed to have infinite significant digits.
- The resulting “p-chart” typically provides useful information to stakeholders and builds intuition about the engineered system. An “out-of-control signal” is defined as a case in which the fraction nonconforming for a given time period, p, is either below the lower control limit (p < LCL) or above the upper control limit (p > UCL).
- If not, they call the signal a “false alarm” and again leave the system alone.
- Note that applying the revised limits to the startup data could conceivably cause additional out-of-control signals to be identified.
Example (Restaurant Customer Satisfaction) An upscale restaurant chains executive wants to start SPC charting to evaluate and monitor customer satisfaction. Every week, hosts or hostesses must record 200 answers to the question, “Is everything OK?” Set up the appropriate SPC chart.
Answer: It is implied that if a customer does not agree that everything is OK, then everything is not OK. Then, also, the restaurant party associated with the unsatisfied customer is effectively a nonconforming unit. Therefore, p-charting is
relevant since the given data is effectively the count of nonconforming units. Also, the number to be inspected is constant so a fixed value of n = 200 is used in all calculations. First, the trial limit calculations are
p0= (total number nonconforming) ÷ (total number inspected) = 252/5000 = 0.050,
UCLtrial = 0.050 3.0 × sqrt [(0.050) × (1 – 0.050) ÷ 200] = 0.097, CLtrial = 0.050, and
LCLtrial = Max {0.050 – 3.0 × sqrt [(0.050) × (1 – 0.050) ÷ 200], 0.0} = 0.004.