Some Other Histograms In Six-sigma
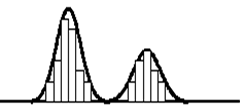
Bi-modal Distribution:
These histograms appear to have two or more (polymodal) behaviors occurring in one process and appear to have two points of central location.
This can be caused by two sets of data being analyzed as one that are from different populations such as plotting the heights of females and males as one distribution.

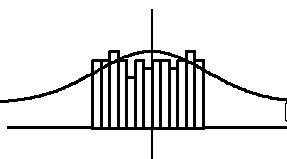
Uniform Distribution:
The distribution is flat or not exhibiting much of a bell shape and has no appearance of a central location.
This may occur when all values between a lower specification limit (LSL) and upper specification limit (USL) are weighted equally acceptable.
In other words, values very close to the limits are as a good as a value in the middle.

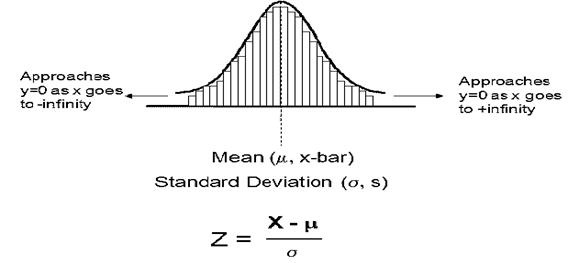
Normal Distribution:
Points are evenly distributed among a central value or location.
The mean is used to describe the central location of distribution. The median, mode, and mean are all close to the same value AND the coefficient of skewness is close to zero.

Coefficient of Skewness:
Karl Pearson is credited with developing the formula below to measure the coefficient of skewness. The formula compares the median with the standard deviation of the same distribution.

IF:
1. SK > 0 then skewed right distribution
2. SK = 0 then normal distribution
SK < 0 then skewed left distribution