←
Control Systems - 1
Determination Of Static Acceleration Error Constants
Determination of static acceleration error constants
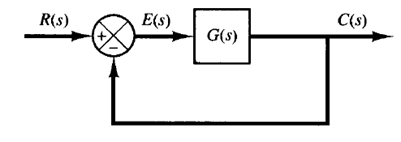
Fig: 1 Unity-feedback control system
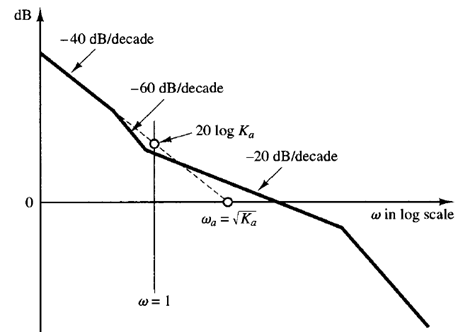
Fig: 2 Log-magnitude curve of a type 2 system
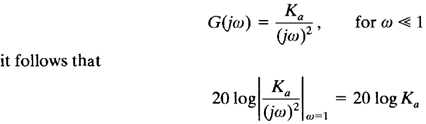
Consider the unity feedback control system shown in Figure 1. Figure 2 shows an example of the log-magnitude plot of a type 2 system. The intersection of the initial -40-dB/decade segment (or its extension) with the ω = 1 line has the magnitude of 20 log Ka. Since at low frequencies
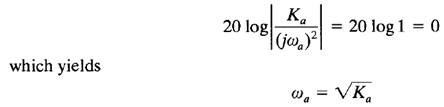
The frequency ωa at the intersection of the initial -40-dB/decade segment (or its extension) with the 0-dB line gives the square root of Ka numerically. This can be seen from the following: