Control Charts For Attributes
Control Charts for Attributes:
Control charts for attributes are used to measure quality characteristics that are counted rather than measured. Attributes are discrete in nature and entail simple yes-or-no decisions. For example, this could be the number of nonfunctioning light-bulbs, the number of rotten apples, or the number of complaints issued. Two of the most common types of control charts for attributes are p-charts and c-charts. The qualitative characteristic of the manufactured product can not be expressed numerically; but simply we consider its presence and absence. Here we consider the number of defects per item. The control charts for the such situations are called control charts for attributes.
There are three types of control charts for attributes :
1. p-chart of proportion defectives.
2. np-chart for number of defectives.
3. c-chart for number of defects.
P-Chart:
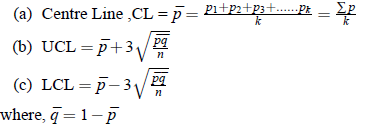
p-Charts are used to measure the proportion that is defective in a sample. The computation of the center line as well as the upper and lower control limits is similar to the computation for the other kinds of control charts. To obtain the p-chart we use following steps:
1. Find the proportion of defectives in each sample:

2. Find the mean ( ¯ p) of the sample proportions:
3. Compute control limits:

np-Chart:
np-Charts are used to measure the number of defective items in each sample. It is better to consider np-chart, when sample sizes are equal. For np-Charts the control limits are as follows:

Sometimes the lower control limit is negative, which occurs because the computation is an approximation of the binomial distribution. When this occurs, the LCL is rounded up to zero because we cannot have a negative control limit.
c-Chart:
When it is necessary to control the number of defects , then we construct a c-chart . For example, number spots on a paper, number of defects on a polished plate, number of defects in a piece of cloth, etc. The process of constructing c-chart is as follows:
1. Central Line: First of all calculate the average number of defects ( ¯ c) where ¯ c is given by

2. Control Limits: Control limits based on Poisson distribution are as follows:
(a) Upper Control Limit UCL 
(b) Lower Control Limit LCL 