Oc Curves And Average Sample Number
Example(Student Evaluation at a Teaching Hospital)
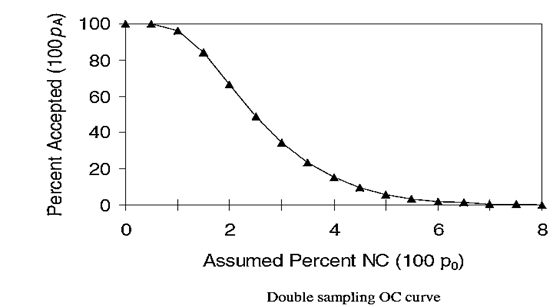
Consider a teaching hospital in which the N = 7500 patients are passed through a training class of medical students in a probationary period. The attending physician inspects patient interactions with n1 = 150 patients. If less than or equal to c1 = 3 student-patient interactions are unacceptable, the class is passed. If the number unacceptable is greater than r = 6, then the class must enter an intensive program (lot is rejected). Otherwise, an additional n2 = 350 interactions are inspected. If the total number unacceptable is less than or equal to c2 = 7, the class is passed. Otherwise, intensive training is required. Develop an OC curve and comment on how the benefit of double sampling is apparent.
Answer: Figure shows the OC curve calculated using an Excel spreadsheet. Generally speaking, a desirable OC curve is associated with a relatively steep drop in the acceptance probability as a function of the true fraction nonconforming (compared with single sampling with the same average sample number). In this way, high quality classes of students (lots) are accepted with high probability and low quality lots are rejected with high probability.

Double Sampling Average Sample Number:
1. OC curves can help quantify some of the benefits associated with double sampling and other sampling methods compared with single sampling. Yet, it can be difficult to evaluate the importance of costs associated with these benefits because the Number of inspections in double sampling is random. The average sample number (ASN) is the expected number of units inspected.
2. Assume that the application of the sampling methods is done carefully to make the units inspected be representative of the whole lot of units. Then, the application of hyper geometric probability mass functions and the assumption of independence give the following formula:
i. ASN (double sampling) = n1 Pr{X ≤ c1} × n2 (10.39)
3. Where X is distributed according to the hyper geometric probability mass function. Note that the average ample number is a function of the true number nonconforming M = p0 × N, which must be assumed. Of course, ASN (single sampling) = n, independent of any assumptions. Generally speaking, comparable OC curves can be achieved by single and double sampling with ASN (single sampling) considerably higher than ASN (single sampling).
Example(Single vs Double Sampling)
Consider a lot with N = 2000, single sampling with n = 150, and c = 3, and double sampling with n1 = 70, c1 = 1, r = 4, n1 = 190, and c2 = 4. These single and double sampling plans have comparable OC curves. Compare the average sample numbers (ASN) under the assumption that the true fraction nonconforming is 3%.
Answer: Under the standard assumption that all units in the lot have an equal chance of being selected, the hyper geometric mass function is reasonable for predicting ASN. For single sampling, the ASN is 150. Assuming 3% are nonconforming, M = 0.03 × 2000 = 60. For double sampling, the
ASN = 70 (0.1141 0.2562) × 190 = 140.3.