Xbar Charts And Average Run Length
Introduction: Six sigma is a purely management based tool, which implies on the scheduling and planning strategies by which we can improve our profit.
Xbar charts and average run length:
An important role of Xbar charting and other charting procedures is to signal to local authority resources that something unusual is happening that might be fixable. In this regard, there are two kinds of errors that can occur:
(1) Nothing unusual or assignable might be occurring, and local authority might be called in. This wastes time, diminishes support for charting efforts, and can increase variation. This is analogous to Type I error in hypothesis testing.
(2) Something unusual and assignable is occurring, and local authority is not alerted. This is analogous to Type II error in hypothesis testing.
An analysis of these risks can provide insight to facilitate the selection of the chart sample size, n, and period between samples, τ.
The Chance of a Signal:
1. Analysis of Xbar charting methods starts with the assumption that, with only common causes operating, individual observations are independent, identically distributed (IID) from some unknown distribution.
2. Then, the central limit theorem
3. guarantees that, for large enough sample size n, Xbar will be approximately normally distributed. Denoting the mean of individual observations μ and the standard deviation σ0, the central limit theorem further guarantees that Xbar will
4. have mean equal to μ and standard deviation approximately equal to σ0 ÷ sqrt[n].
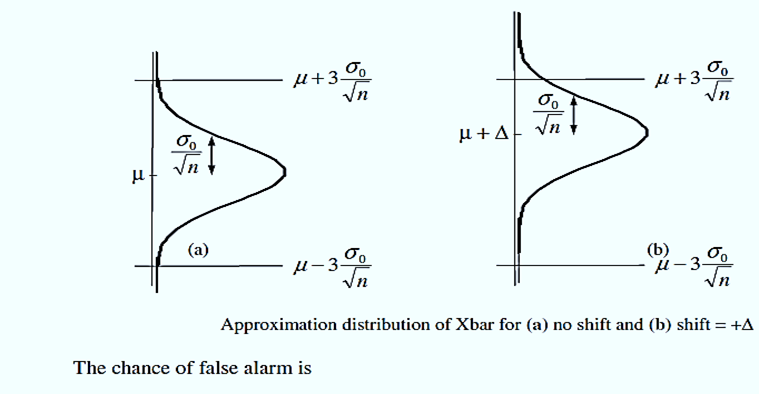
5. the approximate distributions of the charted Xbar values for two cases. First, if only common causes are operating (the unknown distribution of the quality characteristic stays fixed), the Xbar mean remains μ and standard deviation approximately equals σ0 ÷ sqrt[n]. The event of a false alarm is {Xbar > UCL or Xbar < LCL}.
6. The probability of this event is approximately

1. where the symmetry property of the normal distribution and were applied. The phrase “false alarm rate when the process is in-control” is often used to refer to the above probability.
2. The second case considered here involved a shift of “Δ” in the mean of the distribution of the individual observations because of an assignable cause. This in turn causes a shift of Δ in the mean of Xbar as indicated by
